Monday, December 10, 2012

The Cost of Pharmaceutical Facilities


By Dr. Scott Rudge

How many of you are trying to scratch up the coin to give your kids a pharmaceutical facility this Christmas?  Yeah, me neither.  But I had a recent project that required me to come up with an estimate for facility costs, if only to calculate the cost of ownership for a Contract Manufacturing Organization.  This can be an important aspect of the cost of goods, as someone has to pay for the construction, operation and maintenance of a pharmaceutical plant. 

As you might expect, this cost is highly dependent on the type of facility that gets constructed, its purpose, what it was before, and a host of other factors.  Each project is undoubtedly unique but some value can be derived by knowing the range of costs, and some factors that can affect your cost.

For data, I used the Facility of the Year winners in all categories since 2007, when the ISPE/Interphex started to publish this data.  Again, the facilities evaluated in this “category” of facilities are highly divergent in scope and purpose.  Furthermore, to be a winner, it is not necessary to have the most highly finished, modern facility.  There are a few categories, such as Sustainability, Project Integration and Technology that do not focus on the facility itself, but on other aspects that make the project unique.  Here then, is the raw data:


Company
 Cost
 Sq. ft.
 cost/s.f.
purpose
location
Year
Chiesi
 $   117,480,000
236,806
 $ 496.10
R&D Center
Italy
2012
Eisai
 $    41,000,000
2,180,189
 $ 18.81
small molecules
India
2012
Merck
 $   315,000,000
214,000
 $ 1,471.96
vaccines
USA
2012
Rentschler
 $     9,900,000
9,800
 $ 1,010.20
biologics api
Germany
2012
Roche
 $   209,871,400
161,458
 $ 1,299.85
R&D labs
Germany
2012
Irish Government
 $    46,400,000
69,965
 $ 663.19
biologics api
Ireland
2012
MedImmune
 $   588,389,000
337,000
 $ 1,745.96
biologics api
USA
2011
Merck
 $   216,000,000
240,666
 $ 897.51
small molecules
USA
2011
Novartis
 $   242,000,000
257,042
 $ 941.48
vaccines
Germany
2011
Pfizer
 $    42,300,000
173,837
 $ 243.33
small molecules
Germany
2011
Pfizer
 $   188,700,000
54,465
 $ 3,464.61
biologics api
Sweden
2011
Hoffman LaRoche
 $    11,891,102
3,444
 $ 3,452.70
fill/finish
Switzerland
2011
Shire
 $   230,000,000
200,000
 $ 1,150.00
biologics api
USA
2011
Biogen Idec
 $    39,100,000
50,000
 $ 782.00
biologics api
USA
2010
Genentech
 $   194,000,000
102,000
 $ 1,901.96
biologics api
Singapore
2010
MannKind
 $   163,100,000
251,876
 $ 647.54
inhalers
USA
2010
Pfizer
 $   189,613,542
133,000
 $ 1,425.67
biologics api
Ireland
2010
Pfizer
 $   254,674,792
177,066
 $ 1,438.30
fill/finish
Ireland
2010
Aseptic Technologies
 $     4,980,000
12,917
 $ 385.54
fill/finish
Belgium
2009
Centocor
 $   586,000,000
264,000
 $ 2,219.70
biologics api
Ireland
2009
Centocor
 $    24,900,000
7,219
 $ 3,449.23
fill/finish
Switzerland
2009
hameln
 $    44,500,000
99,028
 $ 449.37
fill/finish
Germany
2009
Orchid
 $    35,720,000
107,642
 $ 331.84
small molecules
India
2009
Roche
 $   370,000,000
209,896
 $ 1,762.78
biologics api
Switzerland
2009
GSK
 $     6,300,000
150,695
 $ 41.81
fill/finish
Italy
2009
Pfizer
 $    55,000,000
83,958
 $ 655.09
solids
Germany
2008
BI
 $    64,700,000
95,357
 $ 678.50
R&D labs
Germany
2008
BMS
 $    90,687,000
132,410
 $ 684.90
solids
USA
2008
IDT Biologika
 $    37,470,000
50,568
 $ 740.98
vaccines
Germany
2008
Hoffman LaRoche
 $   460,000,000
355,209
 $ 1,295.01
biologics api
Germany
2008
Cook
 $    70,000,000
124,000
 $ 564.52
biologics api
USA
2007
Genentech
 $   375,000,000
500,000
 $ 750.00
biologics api
USA
2007
Roche
 $    16,640,000
22,604
 $ 736.15
small molecules
China
2007
Taiyo
 $    38,580,000
126,411
 $ 305.19
fill/finish
Japan
2007
Vetter
 $   134,000,000
172,223
 $ 778.06
fill/finish
Germany
2007

What can we make of this data?  The statistics aren’t incredibly helpful for total cost.  The range of costs are approximately $5MM to $500MM, the median is just under $91MM.  The distribution of data is heavily skewed to the lower budget, as shown below:

 The cost per square foot is a little more normally distributed, with a few outliers above $3000/s.f., but most around the mean of $1111/s.f., as shown below:

Is there inflation in the data, represented by an increasing cost per square foot year over year?  The statistics show an average increase of just over $100/s.f., which would be an inflation rate of 9% against the mean cost.  However, the statistical evidence is very weak and heavily influenced by the two facilities that cost more than $3000/s.f.  The regression is shown below:

Finally, although the country data are interesting, there does not appear to be a great correlation between these data and the location of the facility.  While India does have the absolutely cheapest cost/s.f. for a facility, the next three cheapest are Germany, Italy and Japan.  The only country that sticks out is Switzerland, for its extremely high cost.

The data don’t give a lot of hope for predicting the cost of your facility, they are heavily project dependent.  However, they do suggest a range of costs and budgets that might influence your thinking and cost of goods calculations, at least as a first estimate. 

Thursday, September 13, 2012

Calibration Tolerance


Editor's Note:  Interested reader Ray Nims points out that I forgot to square the terms in my propagation of error calculation below.  I apologize for the misinformation.  The corrected blog follows:

In calibration, there is a lot of focus on using the right standard.  Standards must be NIST traceable, have current calibration certifications, and have been cared for appropriately.  See for example ANSI Z540.1 or ISO 17025.  Less attention is paid to the appropriate accuracy of the standard.  In this short blog, we will discuss the basis for instrument range, instrument tolerance and standard tolerance.

An early example of a calibrated measurement device

The tolerance of a process for variation in a certain parameter should be set in process development.  Ideally, this is done as part of process characterization, where the effect of parameter variation is measured.  Some examples of operating ranges set in process development are temperature ± 2°C, pH ± 0.2 units and conductivity ± 10 mS/cm.  Ranges this tight put some pressure on calibration to be especially accurate.  After all, if your instrument is reporting a measurement right at the limit of the acceptable range, it’s probably very important that the instrument not be inaccurate by very much, if at all.

The National Conference of Standards Laboratories (now known as NCSL International) recommends that instruments be calibrated with an uncertainty of no more than 25% of the acceptable control range.  This means that the tolerance (or uncertainty) for the instruments measuring temperature, pH and conductivity cited above would be ± 0.5°C, ± 0.05 and ± 2.5 mS/cm, respectively.  These are tight tolerances, but are needed to ensure that the process is really within ± 125% of the target range.

But wait, there’s more!  You can only be sure that the measuring instrument is within tolerance if you know that the uncertainty of the standard used to calibrate it.  Even standards are not necessarily 100.00% accurate, are they?  Standards used for calibration also have a known uncertainty, and again NCSL International recommends at least a 4:1 ratio of standard to instrument uncertainty.  So the standard used for the instruments above should have a tolerance of no more than ± 0.125°C, ±0.0125 and ± 0.5125 mS/cm, or 6.25% of the operating range. This uncertainty also carries through to the uncertainty of the measurement.  Taken absolutely, the widest range possible range is ± 131% of the actual or target range.  However, it should not be assumed that uncertainty randomly falls to the extremes of the allowable ranges.  It is more common to perform a propagation of errors calculation.  Here, the squares of the errors are added, and the square root of the sum calculated, as shown below

This gives a more likely range of ±126%. 

There is a bottom up approach sometimes taken in determining calibration tolerances.  In this approach, the capability of the instrument is used to determine the calibration tolerance.  In other words, if the thermometer is claimed to have an accuracy of ± 0.1°C by the manufacturer, then it should be calibrated with a temperature standard with an uncertainty of no more than ± 0.025°C.  This approach has proven increasingly difficult, as modern technology has increased the capabilities of field measurement instruments.  However, the approach is valid, and some leeway exists (up to a tolerance ratio of 1:1). 

Of course, higher tolerance ratios are permitted.  But these general guidelines should help you design your calibration program so that you know you are making quality measurements in your process.

Monday, June 18, 2012

Viral clearance studies …. are they needed for proteins produced using bacterial or yeast fermentation processes?

In E. coli or Pichia pastoris-based bioproduction of recombinant proteins, there are no suitable host cells for amplification of viruses that are infectious for humans. Bacteria such as E. coli and yeast such as P. pastoris can only support the growth of certain bacteriophage or yeast viruses, respectively. These types of viruses are not infectious for humans or animals.
The potential for viral infection of a bacterial cell process or a yeast cell process used for production of a recombinant protein is therefore a business risk, not a patient safety risk. This is the reason why case studies of bacteriophage infection of bacterial fermentation processes or of viral contamination of yeast cell processes have not appeared in the literature (or in the news). Unlike virus contamination of animal cell-based production processes, the events involving bacterial or yeast do not have patient safety implications. When a bacteriophage or yeast virus contamination occurs, manufacturers quietly go about the business of restarting the fermentation. Remediation and prevention of future occurrences is driven primarily by business concerns, as opposed to regulatory concerns.
Manufacturers of recombinant proteins produced using bacterial or yeast cell substrates are not required to conduct cell line viral testing (though phage induction studies may be performed as part of bacterial cell line characterization – to mitigate business risk!), nor are they required to conduct lot-by-lot viral testing of bulk harvest samples. Such requirements are mandated for production processes using animal or human cells. As the title of the document “Quality of Biotechnological Products: Viral Safety Evaluation of Biotechnology Products Derived from Cell Lines of Human or Animal Origin” indicates, the ICH Q5A (R1) guidance mandating such testing is clearly directed toward manufacturing processes utilizing the types of cells which may support growth of viruses infectious for human or animal cells. This ICH document also provides guidance on the conduct of viral clearance studies.

Viral clearance studies are intended to provide evidence of the ability of downstream purification steps of a manufacturing process to remove or inactivate viruses that potentially may contaminate the process, make their way into final product, and represent a health risk to patients. As such, the evaluation typically involves both relevant viruses (i.e., viruses that are known to contaminate these kinds of processes) and model viruses (i.e., viruses representative of the types of viruses that could contaminate these processes). In the case of bacteria- and yeast-based manufacturing processes, the relevant viruses (bacteriophage and yeast viruses, respectively) are not infectious for humans or animals. In addition, there are no model viruses that are capable of infecting these kinds of cells that are of concern for humans or animals. Therefore, viral clearance studies are typically not required or conducted.

Are there any circumstances where a bacterial or yeast fermentation process could be expected to harbor a virus capable of infecting humans? The only that I can imagine is a process utilizing primary or secondary animal-derived raw materials in rather large quantities. The worry would not be that viral amplification might occur, but that some carryover of surviving animal viruses to the final product might be possible. The use of such animal-derived materials by a manufacturer of a therapeutic protein must be justified based on risk analysis. If substantial risk is introduced by the use of such raw materials, then perhaps a raw material treatment approach would need to be validated.

In the absence of the use of animal derived materials or plant materials not subject to processing steps that would inactivate contaminating animal viruses, incorporation and validation of viral clearance steps into protein production processes using bacteria or yeast cell substrates is not expected, nor would this be of practical value in assuring patient safety.

Thursday, May 24, 2012

Update: New USP General Chapter 1050.1


There is a new general chapter being prepared for inclusion in the United States Pharmacopeia (USP). It will be entitled “Design, Evaluation, and Characterization of Viral Clearance Procedures” and will be numbered 1050.1 to associate it with the current General Chapter <1050>.

A little history is called for to make this association more clear. Chapter <1050> first appeared in supplement 10 of USP23-NF-18 in 1999. It was, and still is, a verbatim copy of the International Conference on Harmonisation (ICH) document Q5A R1. In fact, it has an identical title: “Viral Safety Evaluation of Biotechnology Products Derived from Cell Lines of Human or Animal Origin”.

In many respects, U5P Chapter <1050> (and ICH Q5A R1) is similar in content and philosophy to the 1993 US FDA Points to Consider (PTC) document entitled "Characterization of Cell Lines used to Produce Biologicals".  Like the 1993 PTC, USP Chapter <1050> expresses an overall safety paradigm composed of three orthogonal approaches. These approaches may be summed up as consisting of testing of raw materials and cell banks, testing of unprocessed bulk harvest, and evaluation of viral clearance steps used during purification. Also like the 1993 PTC, Chapter <1050> describes potential sources of viral contamination, including raw materials and the cell substrate. The scopes of the documents are similar, applying to products derived from cell lines. Transmissible spongiform encephalopathy agents and live or inactivated intact viral vaccines and gene therapy vectors are out of scope and are covered by other guidance documents.

Due to the potential for introducing a viral contaminant through use of an infected cell substrate (e.g., SV40 in polio vaccine, or more recently PCV-1 in rotavirus vaccine), USP Chapter <1050> and the 1993 PTC address the concept of cell banking and the extensive viral testing that is required for cell banks at the Master Bank, Working Bank, and Limit of Cell Growth levels. The second approach of the safety paradigm is the requirement for lot-to-lot testing of the unprocessed bulk harvest. Testing is done at this level as opposed to purified product since purification is designed to eliminate viruses and therefore might preclude the manufacturer from discovering a viral infection. It is the intent of the regulatory agencies that potential opportunities for introduction of a viral contaminant be investigated and remediated, so testing is done prior to purification. The viral testing that is required for unprocessed bulk harvest is a subset of the tests done on the cell banks.

Both USP Chapter <1050> and the 1993 PTC discuss the limitations of viral testing as a sole means to assure viral safety, and this provides a segue for discussion of the need for viral clearance steps and the validation of the ability of such steps to clear viruses from the product. In fact, USP Chapter <1050> does a good job of providing the fundamentals of viral clearance evaluation, however there was a feeling expressed by some in the industry (and especially Mike Rubino, a member of the original ad hoc advisory panel for this chapter) that more detailed guidance on experimental design was needed. This, by the way, is true in general about Chapter <1050> (and IQH Q5A Rl upon which USP <1050> was based) that it is strong on philosophy but weak on specific methodological detail.

The original USP ad hoc advisory panel for Chapter <1050> revision was assembled with the purpose of updating the chapter to include this missing experimental detail. The panel went through each section of the existing chapter and added the detail that was felt to be lacking. This was done with the overall mandate to avoid introducing any new language that might conflict with the original language (and ICH Q5A Rl). The revised Chapter <1050> was published in the Pharmacopeial Forum in 2010. Responses obtained indicated that there was reluctance to modify in any way the language of this chapter without also modifying ICH Q5A. The situation as of February 2011 was described in an earlier posting.

As a result, the USP decided to keep Chapter <1050> intact and identical to ICH Q5A Rl.  A new ad hoc advisory panel was assembled with the purpose of producing a new chapter in the general information series that would be a companion to the existing Chapter <1050>. The new chapter received the number 1050.1 and provided the vehicle for adding the desired methodological detail.

The proposed new General Chapter <1050.1>, entitled "Design, Evaluation, and Characterization of Viral Clearance Procedures" consists of some background information on process evaluation and process characterization, then launches into experimental design for evaluating both inactivation and removal steps. The latter section includes some specific experimental design flow charts addressing virus removal by filtration and chromatography and virus inactivation. Along with the flow charts describing the design of the studies are description of the methods used to assess potential cytotoxicity or interference caused by the process materials themselves.

The subheadings of the background information are shown in the text box below.


The information presented under these subheadings reflects the panel's understanding of current regulatory expectations. Regulatory input obtained during the public comment period will assure that the panel's perceptions were correct. Discrepancies will be corrected as required.

Finally, a goal of the new chapter was to provide an updated list of the types of viruses that have been and may be used in viral clearance evaluations. For studies enabling clinical trials, it is common for evaluations to use a parvovirus such as MMV and a retrovirus such as X-MuLV as models. This provides a small non-enveloped virus to challenge filtration steps, as well as an enveloped virus to assess inactivation steps designed for lipid enveloped viruses. For BLA enabling studies, a few additional viruses may be selected from this updated list, keeping in mind that the viruses should represent a diversity of characteristics (envelope status, genome type, size, etc.).

The intention of the new chapter <1050.1> is that manufacturer’s may use the methods as appropriate to their own processes and will be able to cite the guidance in their descriptions of the study design. At the present time, no guidance having sufficient experimental design descriptions is available to cite in this respect. The planned date for publication of the proposed chapter in the Pharmacopeial Forum is January 2013.

Tuesday, May 1, 2012

Relative Humidity Specification at Refrigerated Conditions


By Dr. Scott Rudge

The ICH has established well known temperature and humidity standards for conducting stability studies that mimic the environments in various parts of the world.  Zones I and II correspond to cold and temperate areas respectively, such as North America and Europe, while Zones III and IV correspond to hot and dry or hot and humid climates, like Equatorial Africa, Brazil and lower altitude South America and southern Asia including India.  There are exceptions within these regions, to find out the zone for a specific country, you should reference ICH Q1F or WHO Technical Report Series No. 953, 2009.  These stability conditions are for pharmaceuticals meant to be stored at room temperature.  And it makes sense to consider relative humidity at room temperature, the amount of water in the air can be substantial.  But recently, we’ve had clients specifying a relative humidity in refrigerated conditions.  This is not an ICH requirement, but perhaps with very moisture sensitive products, it makes sense to specify this and control it.
Relative humidity is a fairly familiar concept.  We know that when it’s humid out, it feels hotter.  Your clothes don’t dry, and neither do you!  As I’m sure all the readers of these posts know, “relative” humidity is the amount of water vapor in the air relative the air that is saturated with water.  This is expressed most conveniently as the measured partial pressure of the water vapor in the air divided by the vapor pressure of water at the temperature of the “system”.  The vapor pressure of water is a strong function of temperature, as shown in the following graph:


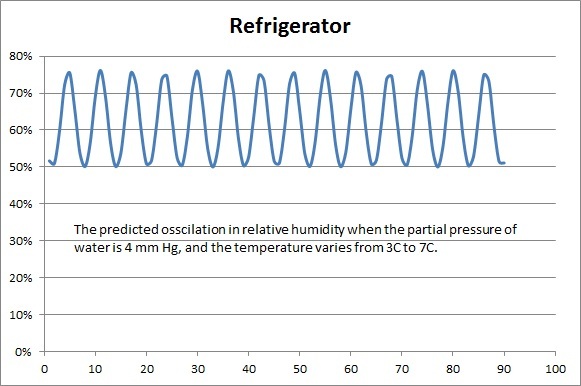
As the temperature goes towards 0°C, the vapor pressure goes to zero.  It doesn’t reach zero, as ice also has vapor pressure, but it gets close.  At 2°C, the vapor pressure is 5.2 mm Hg at 8°C, it is 8 mm Hg.  So, in the case of a refrigerator, where you might store pharmaceuticals, whatever humidity is in the refrigerator is divided by a very small amount of humidity that represents saturation.  In fact, you would predict that, at a constant partial pressure of water, say 4 mm Hg, the relative humidity would vary with an amplitude of 25% with a temperature range of 4 ± 2°C, as shown below.
 We tested this in one of our refrigerators at RMC, and found the actual situation to be a little worse, an amplitude of about 40%. The amount of water in the air in our 13.75 ft3 refrigerator is 1.65 grams.  That’s quite a bit of water in the air, but a relative humidity profile that seems more or less uncontrollable.
So what’s the answer?  It doesn’t seem that specifying a relative humidity range for a refrigerator is a great idea.  On the other hand, if you have water sensitive samples that are not otherwise protected, you are probably playing with fire.  The use of a desiccant and vapor impermeable overwraps that have been seal tested is probably a requirement.